Showing posts with label Statistics. Show all posts

Thursday, December 1, 2016

What's the deal?

Over the past two years, #M323 teacher-leaders have designed several centers associated with Common Core State Standard 6.SPA.3. Below is one of my favorites, which I am attempting to revise for my #M221 pre-service teachers. Any feedback you are willing to provide would be appreciated.

=====
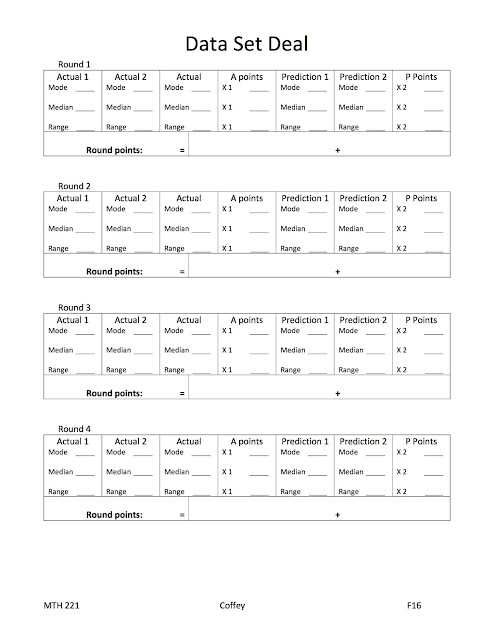
Data Set Deal
Rules
  • Remove all the face cards and Jokers from a deck of cards;
  • Deal out five cards, face down, to each player;
  • Turn over exactly three cards;
  • Determine the mode (color), median (number), and range (number) of the three cards;
  • Other players check to see that your answers are correct [1 point per correct answer];
  • Predict the mode (color), median (number), and range (number) of all five cards;
  • Turn over another card;
  • Determine the mode (color), median (number), and range (number) of the four cards;
  • Other players check to see that your answers are correct [1 point per correct answer];
  • Predict the mode (color), median (number), and range (number) of all five cards;
  • Turn over the last card;
  • Determine the mode (color), median (number), and range (number) of all five cards;
  • Other players check to see that your answers are correct [1 point per correct answer];
  • Check to see which of your predictions were correct [2 points per correct answer]; and
  • The winner is the first one to 21 points.

Score Sheet
=====
Please leave any questions or suggestions in the comments. Thanks!

Friday, November 25, 2016

We're really going to get to do it, aren't we?

One of the projects the pre-service elementary teachers (math majors) that I teach worked on this semester was designing a 4th-grade statistics lesson to address 4.MD.B.4.


The teachers went through a design cycle to make the lesson. They ... 

  • Built empathy by observing two fourth-grade classes;
  • Defined the problem by developing a User/Needs/Insight statement;
  • Brainstormed a variety of possible activities;
  • Developed a prototype SAFARI Lesson;
  • Tested the lesson by sharing it with the classroom teacher; and
  • Revised it based on her feedback.
Three teachers co-taught the lesson in two different fourth-grade STEM classes. They made adjustment between the lessons based on what worked and what didn't. Afterwards, they reflected on the experience and shared the lesson with me. The lesson was so cool, I decided to make a few adjustments and use it in another class for pre-service elementary teachers (mostly non-math majors) that I teach. Here is the SAFARI Lesson that I taught.

Schema Activation - Prediction
Directions: "You have two sticky notes. On the green sticky, I want you to predict the number of seconds you think it would take you to write the alphabet from A to Z. On the purple sticky, I want you to predict how long it would take you to write the alphabet in reverse order from Z to A. You have a quarter of a minute. Go!"

Focus - 5.MD.B.2
Share lesson target: "We are going to make line plots to display data sets of measurements in fractions of a unit."

[Anticipated learner responses are in brackets.]

"Who thinks they can write the alphabet forward the fastest? [13 seconds or 2 letters per second] Who thinks they will take the most time to write the alphabet forward? [52 seconds or 1 letter every 2 seconds] Alright, let's get up and stand in order from fastest predicted time to slowest predicted time."

Learners order themselves

"As I listened in, it became apparent that several of you made similar predictions. It would be interesting to see how the predictions cluster. But we could potentially have a lot of unique guesses. In order to gather those guesses, let's round our predictions to the nearest quarter-of-a-minute. For example, Sam guessed 20 seconds forward and 55 seconds backwards. He would round to 1/4 of a minute for forward and one minute, four-fourths, backwards. Work with your neighbors to round your predictions to the nearest quarter-of-a-minute and then post them on the board - forward at the front and backwards at the back."

Learners post rounded predictions

"What do you notice about the data sets?" [The writing in reverse predictions are "higher" and more spread out than the forward predictions.] 

"Why?" [We are familiar with writing the alphabet forwards so we think we can do it faster and know more what to expect.]

Activity - Writing the Alphabet in Reverse Order

Directions: "I am going to give you three pieces of paper."
At this point in my lesson, one of the pre-service teachers asked, "We're really going to get to do it, aren't we? We're really going to find out how long it takes us to write the alphabet from Z to A? Is it weird that I am so excited about this?" I reassured her that it wasn't weird - that my other pre-service teachers had designed a pretty cool lesson.

Directions continued: "You have a choice. On the yellow paper, you may write the alphabet forward on one side and use it to help you to write it from Z to A on the other side. You'll see the second sheet has the alphabet already on the back in the form of classic blocks, like the ones my grandson plays with. If you choose that one, you will incur a 1/2 minute penalty, which means you will add 30 seconds to your time. The last piece is simply scrap paper; use it if you want to try to write the alphabet from Z to A without any other support.


"A few more things: 

  • You must start at Z and write the letters in reverse order to A. You can't cheat and start at A on the right-side of your paper. 
  • The letters must be legible. Your table-mates will decide if they can read your letters, and you will earn a 5 second penalty for each letter they can't read.
  • When you finish, check the timer on the front board, record your time, and round it to the nearest quarter-of-a-minute.
At this point, a student rose his hand to ask a question. The girl who was so excited blurted out, "I just want to get started!" The other student asked if the letters had to be upper or lower case. I said it didn't matter to me.

Set the online stopwatch and say, "Go!"

When everyone is finish, have learners trade papers check letters for legibility.

Reflection - Noticing and Naming
Directions: "If you used the yellow paper (wrote A to Z on the back), write your result, to the nearest quarter-of-a-minute, on the yellow sticky note. If you used the blocks, and added 30 seconds to your time, write your rounded result on the blue sticky note. If you did it without any support, write your rounded result on the pink sticky note. Your rounded results go on the line plot on the back board underneath your predictions."


"What do you notice?" [Look for opportunities to introduce terminology related to measures of center and spread, like median, mode, and range]

I want to ... - Choice
Directions: "What do you want to do now? Here are some ideas:
  • Try it again using a different level of support and add it to the line plot;
  • See if there is a difference between writing in upper and lower case;
  • Try it forward and compare it with your prediction;
  • Gather more data from your friends and family over Thanksgiving;
  • Consider other activities that ask people to do familiar things in unfamiliar ways and what the data might show; or
  • Come up with your own idea to extend your learning."


Wednesday, November 23, 2016

What's the hurry?

The moment you (some of you) have been waiting for [insert drumroll] ... the Carousel Lesson Design process. Previously, we learned about SAFARI lessons and prototyping. In this post, I share how to encourage teachers to embrace creativity and connectivity while collaborating on a week long unit design.


First, you need some ingredients. It's best if you have: 
Investigations Curriculum

  • 5 willing teachers;
  • 1 set of targets;
  • 1 rich curriculum;
  • 5 pieces of easel paper;
  • Various scented (optional), colored markers;
  • Multiple sticky notes;
  • 1 lesson design framework; and
  • 1 timer
Each teacher is assigned one of five sequential lessons and given 5 minutes (no more, no less) to look through the lesson in order to determine what is important.  At the end of this time, they use another 2 minutes to set up the SAFARI lesson framework on their easel paper and write down some of the most important ideas from the lesson they were assigned.


After 2 minutes the teachers rotate (like a Carousel) to the next lesson. Day 1 goes to Day 2 ... and Day 5 goes to Day 1. They use what they know from their own lesson and the important points the previous teacher wrote down to inform them about the lesson. They also have exactly 2 minutes to add to the lesson. I am constantly reminding them, "Don't worry about designing it perfectly. You don't even know for sure what the lesson is about. Don't worry about offending the teacher that started the lesson. They spent all of 2 minutes on it so far."

The teachers aren't always crazy about the artificial time crunch. However, it helps to contribute to their creativity (think MacGyverMath) while ensuring progress. It keeps them from letting their perfectionism get in the way.


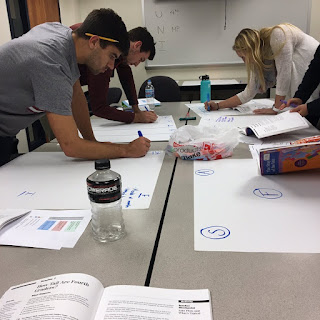
Rotate! And repeat ... three more times (Note: only two interactions shown below) at 2 minutes a piece.


The teachers are now back at their original lessons. They take 1 minute to read through what has been added to their initial ideas. The sticky notes are used to identify questions for the author or indicate likes (thumbs up). The teachers can also continue to add new ideas based on what they have seen in the other lessons. After 1 minute the teachers rotate again and again and again and again and again. At each lesson they answer questions, add stickies, or contribute ideas.

At the end, the teachers have spent 20 minutes to design a five-day unit.


Yes, there is still some work to do to sift out the essential elements of the lesson. These will be written in the SAFARI format and then shared with their peers for feedback. Finally, the lessons are tested out in the classroom. The next post is about one of those lessons.

Tuesday, October 20, 2015

What is the purpose of pre-assessments?

In our course, Probability and Statistics for K-8 Teachers, we are trying to apply Design Thinking to a project involving teaching in a local 6th-grade math class. We will be focusing on 6.SP from the Common Core State Standards. Before we begin planning our lessons, we want to know what students can already do in order to build on their strengths. Therefore, we decided to design a pre-assessment.


We recently went through the Design Thinking process and tested out our pre-assessment ideas with the 6th-grade teacher. Design Thinking is an iterative process, and the feedback we received from the teacher reinforced this idea. It was clear that we had not spent enough time defining the project, which resulted in a lot of disconnected pre-assessment ideas. So tomorrow we will return to the Define step using the Project Priority Puzzle shown below.

Instructions:
  • Select a phrase from each row (whatwhyhow, and when) in the table below that you feel ought to define our 6.SP pre-assessment. If you think a phrase is missing, write it in one of the blank spaces provided; 
  • Use scissors to cut out each of your selections, along with the top phrase; and 
  • Combine the phrases in order from top to bottom using tape to create your “Define” artifact.
Project Priority Puzzle


You could help us out by providing your definition of pre-assessment. Use the puzzle pieces above or create your own. Please add your definitions to the comments. Thank you in advance for your support of our future teachers.

Wednesday, September 23, 2015

How can we assess 3.MD.B.3?

Draw a scaled picture graph and a scaled bar graph to represent a data set with several categories. Solve one- and two-step "how many more" and "how many less" problems using information presented in scaled bar graphs. For example, draw a bar graph in which each square in the bar graph might represent 5 pets. [3.MD.B.3]
Teaching-Learning Cycle
Teachers use #MTBoS as a way to find interesting and effective math lessons. Recently, some of us have noticed that assessments are often lacking as this community shares in the work of teaching. So I am proposing the #MTBoSAP (Math Teacher Blog-o-Sphere Assessment Project) as a way to pass along our wisdom and experience assessing students in our mathematics classes. I figured I could start by sharing some work I am doing in one of my courses for preservice elementary teachers.

The teachers are currently researching assessment items related to the Measurement & Data Domain (focusing on Data) from the Common Core State Standards (CCSS) in Mathematics. One of the third-grade standards in that domain is written at the beginning of this post. Because we are partnering with a school district that uses EngageNY, we looked for assessment items that already existed within that curriculum. This is an exit ticket that we found in the Grade 3, Module 6, Lesson 4
We thought that this item did a fair job of assessing the last part of 3.MB.B.3 but completely missed the first part, "Draw a scaled picture graph and a scaled bar graph..." So we looked through the rest of the lesson and thought this item from the problem set looked promising.
This item has students "draw a scaled bar graph" (still no scaled picture graph) and asks that they solve "two-step 'how many more' and 'how many less' problems." As we thought about it further, however, we were concerned that it was not clear whether students would use the chart or the graph to answer the questions.

Therefore, I decided to try to modify the original exit ticket in order to assess more of the standard. I got rid of two of the bars and wrote questions intended to have them "draw (a part of) a scaled bar graph" and answer multi-step questions that require some "information presented in scaled bar graphs."

Please complete the bar graph using the following information. 
  • The number of books checked out on Thursday was 10 more than the number of books checked out on Tuesday. Draw the Thursday bar.
  • 1,480 books were checked out Monday through Friday. Draw the Friday bar.

What are your thoughts about using this modified assessment item to gather data on students' mathematical understanding related to 3.MD.B.3? Do you have a good item for this standard that you'd be willing to share? If so, please share the item or a link to the item in the comments. Also, If you have any other effective CCSS assessment items, please share them on Twitter using #MTBoSAP. Thank you in advance for all you do to advance the profession.

Friday, October 31, 2014

Will it fit?

I used this lesson in MTH 221 (Mathematics for Elementary Teachers) to address Common Core State Standard 7.G.B.4. It seems to have a lot of potential, but there are still some elements that I think need to be tightened up. These are written in red - along with some other thoughts. I would appreciate any feedback on how to improve this lesson.

[Schema Activation]
How many of you know your fitted hat size? For example, I wear a seven-and-seven-eighths. Today, you are going to find your hat size and what that number means. 
I like the DC cap for a couple of reasons. First, obviously, DC are my initials. Second, it foreshadows the circumference and diameter relationship we will explore in the lesson.

In the past, I have had students measure a bunch of circles to find the ratio between circumference and diameter. It has been a struggle to make it an interesting lesson. This connection to something personal (hat size) seemed like it might be an improvement.

According to LIDS.com, there are a couple of ways to determine your hat size.


We will use both a flexible tape measure and their printable ruler in order to...

[Focus]
... consider the following questions:
  • How are hat sizes and head-measures related? (In other words, if we didn't have access to their table, can we determine a hat size given a head-measure?)
  • We are supposed to be working on CCSSM 7.G.B.4. Is this connected in some way to circles? Too obvious?
  • Why don't hat makers just use the head-measurement as the size?
[Activity]
Measure your head using both the flexible tape measure and the printable ruler.

Feel free to wear the printable ruler as a stylish headband as you work. Optional

Place both your head-measure and hat size on a sticky note and place it at the proper coordinates on our graph.

What does our graph show? Is there a relationship? If so, what do you predict the relationship to be? (If we input 22 inches for head-measurement, what hat size is the output? What if we input C inches?)

Here are a couple of tables for hat sizes from Lids.com. Let's use them to see if we can determine the input-output rule they are using to find hat size from head-measurement. 

There are other hat size tables (for example), but I like that this one makes 22 inches a hat size of 7 because 22/7 is often used as an approximation of pi.

[Reflection]

What did you find? What is the rule?

Des found the following: y = 0.333x - 0.333. Does it work for our table? If it's correct then what hat size does a person need for a head-measurement of 24?

Okay, I wanted to play with the new Desmos linear regression feature - sue me. Is it a problem that this line doesn't go through the origin? That the slope actually represent an approximation of 1/pi? During the lesson, it seemed like this portion required a lot of scaffolding.

So what does the hat size mean? Let's take our headband and place it on the table. Notice that it is nearly the same shape as a circle. Now measure the distance (diameter) across your headband (circle).

In my case, if I measure what is approximately the diameter of my headband, I find the length is close to my hat size (seven-and-seven-eighths). How about you? What does that suggest our hat size means?

The students were most impressed by this portion of the reflection. They liked that the hat size number was not some arbitrary value - that it was actually connected to something mathematical. I looked for some history of hat sizes to explain why this value is used instead of circumference, but Google failed me.

Now what fitted hat size should I buy from Lids.com if my head measure is 24 inches? Seven-and-two-thirds doesn't look like it's an option.

In an earlier unit, students struggled with the idea of independent and dependent variables and creating graphs that accurately represent a real-life situation. Because a hat maker does not make all possible diameters, we decided it didn't make sense to connect the dots. Instead, we came up with the graph shown above.

One of the reasons I like this activity is because it does connect with so many other standards, like 6.EE.C.9 and 6.SP.B.4. What do you think? Does this lesson have merit - is it worth saving? If so, how? Please add your thoughts in the comments.

Updated: As much as I loathe Pi Day, this piece on Stormy Kromers (hats made in the Upper Peninsula of Michigan) might make a nice connection.

TEDxGrandValley